

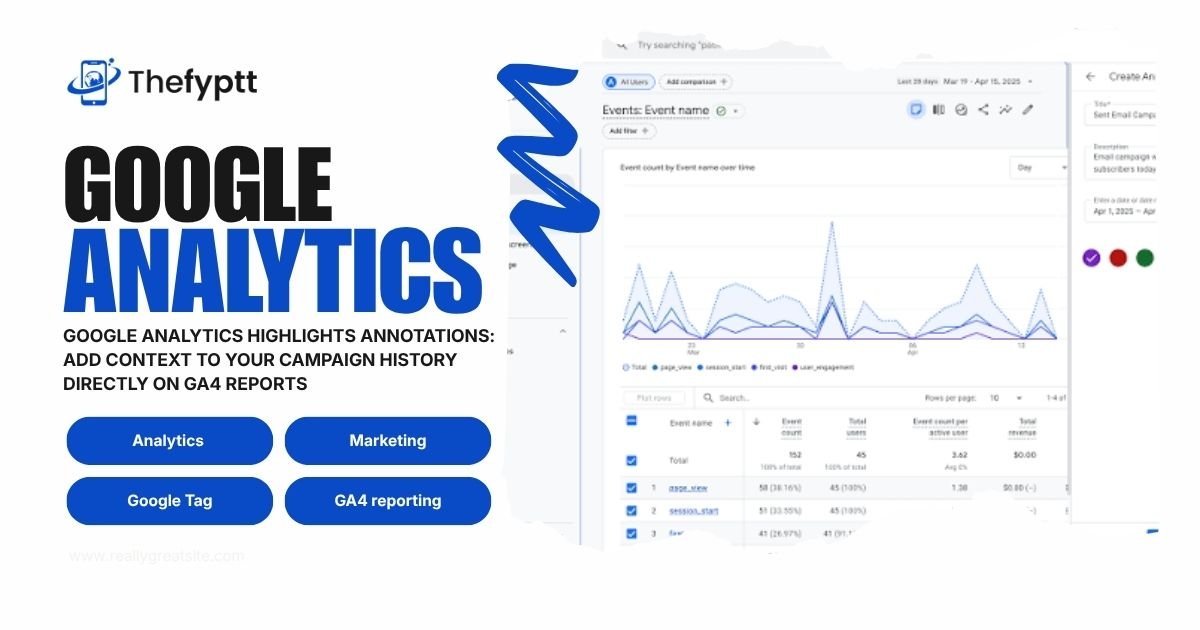

Google Analytics is drawing renewed attention to Annotations, a GA4 reporting feature that lets teams mark important events, campaign milestones, and trend explanations directly on their line graphs, keeping campaign history and context inside the reporting workspace instead of scattered across emails or spreadsheets.
What Annotations Do
Annotations let analysts and marketers attach a note to a specific date on a report chart. According to Google, this makes it easier to document key events, track promotions, and add context to traffic spikes and dips directly within GA4’s standard reports.
Alongside manually added annotations, GA4 also generates automatic system notes that flag major data-impacting events, helping teams quickly spot the difference between a real trend and a one-off anomaly without digging through campaign calendars first.
Why It Matters
Annotations were a widely used feature in Universal Analytics before GA4’s rollout, and their absence was one of the most requested fixes from analysts and marketing teams. Common use cases include:
- Marking the launch or end date of a marketing campaign
- Documenting Google Tag Manager or GA4 configuration changes
- Logging site outages, broken forms, or tracking bugs that affected data
- Recording the start and end of A/B tests or experiments
- Flagging new product or feature launches tied to traffic or conversion changes
By keeping this context attached directly to the chart where a spike or dip appears, teams can align faster during reporting reviews instead of relying on institutional memory or searching through old messages.
Getting Started
Annotations appear on GA4 line graphs in the standard reporting workspace. Google recommends keeping annotations selective and using a consistent format across team members to avoid cluttering reports when multiple people are logging events.
More details on setting up and using Annotations are available in Google’s official Analytics Help documentation.